
Operations · Trades and local services
Your traffic looks fine. Ask what happens to it next.
DOMIK UA's visitor graph climbed every month while the business stayed flat. The fix wasn't in the ad account.
A visitor graph can climb every month while the number that actually pays the bills sits flat. DOMIK UA, a real estate listings platform in Ukraine, had exactly that graph in 2018 — traffic arriving in the numbers a platform like theirs is supposed to want, and a business that wasn't moving. The general version of that pattern is in strong traffic can hide a weak business.
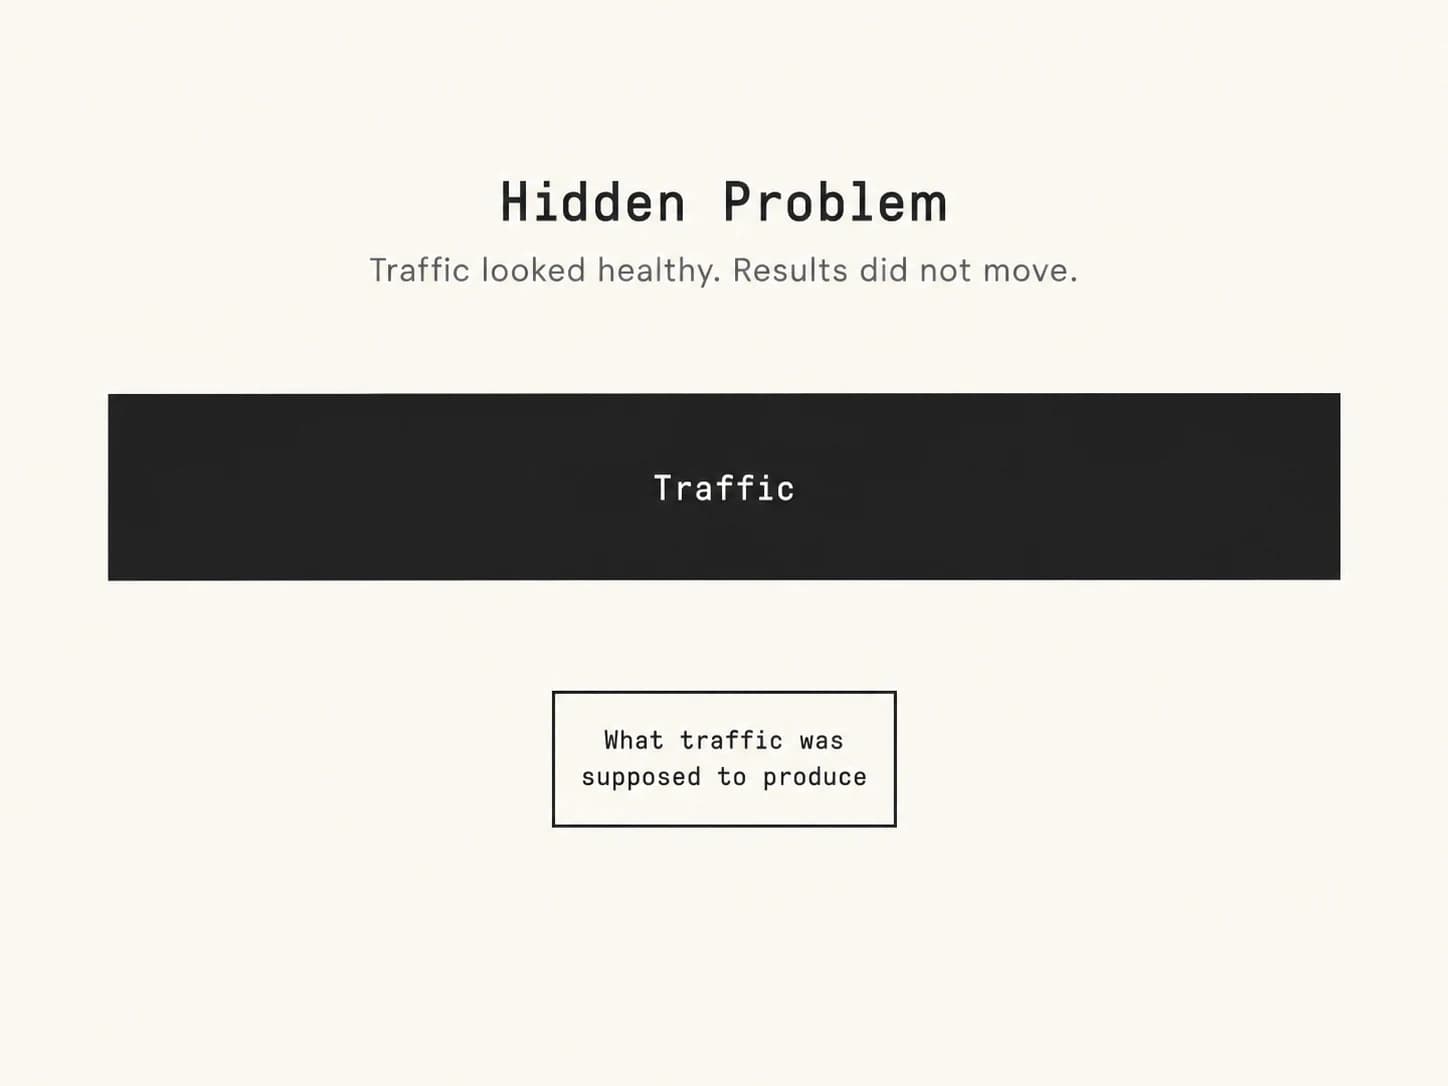
I didn't open the ad account first. I pulled two leads instead, one that a developer had converted into a signed client and one that had gone nowhere, and put the actual submissions side by side on the screen, expecting the difference to be visible in the submissions themselves.
They were identical. Same fields, same questions, same format, no way to tell from either one which visitor had been three weeks from a decision and which had been killing ten minutes on a lunch break. The platform hadn't failed to capture interest. It had never built a way to tell the difference between casual interest and a real one.
Changing only the intake form would have sent better-differentiated leads into a relationship that still had nothing holding a developer there past the first month. Changing only the developer offer would have meant packaging leads that still couldn't be told apart. Both had to move at the same time.
- 2.5×
- improvement in paid traffic converting into leads
- 40%
- quarter-over-quarter rise in developer renewalsDevelopers paying for a second lead, not just trying the platform once
If your own numbers look healthy and the business still doesn't, pull two of your own leads — your best one and your worst one — and put them side by side. If you can't tell which is which from the form alone, neither can whatever you're paying to bring more of them in.
The full engagement record
DOMIK UA — case study