
Sales and marketing · E-commerce and retail
926,812 visitors. 809 orders. The distance between them was the whole business.
A US luxury furniture retailer trading as VIG Furniture asked for a marketing fix. The audit covered sales, marketing, logistics, and IT together, and the margin turned out to be leaking somewhere nobody was looking.
The request at VIG Furniture, three showrooms in Los Angeles, one in Miami, and an online store selling luxury furniture, was to fix the marketing: campaigns weren't paying for themselves, costs were climbing, departments were working past each other. I didn't open the ad account first. I pulled the traffic report.
One order per 1,146 visitors, on $1.19 million of revenue over sixteen months. Nearly a million people came, and almost nobody bought: the kind of ratio that makes you brace for a broken checkout, or a site half of visitors never managed to load. The engagement numbers sitting right next to that ratio ruled out the easy explanation before I'd even reached for it. 2.81 pages a session. 2:17 on site. A 66% bounce rate. That's someone looking, not someone who hit a broken page and left. Whatever was wrong wasn't traffic, and it wasn't the site failing to load. It was everything that happened after someone decided to stay and look.
Retention was 4%. In luxury furniture, the buyer is expensive to win and the second purchase is where the margin actually lives, so a repeat rate that low meant almost all the revenue had to come from finding someone new every time. The device split raised its own question — 35% Safari against 32% Chrome, 35% iOS against 14% Android or Windows, a majority-Apple, majority-mobile audience looking at creative that hadn't been built with either one in mind.
Sales, marketing, logistics, and IT each had their own number for how the business was doing, and none of the four matched. Overlapping systems, duplicated work, decisions stuck between teams because no single name had ever been attached to the workflow that crossed between them.
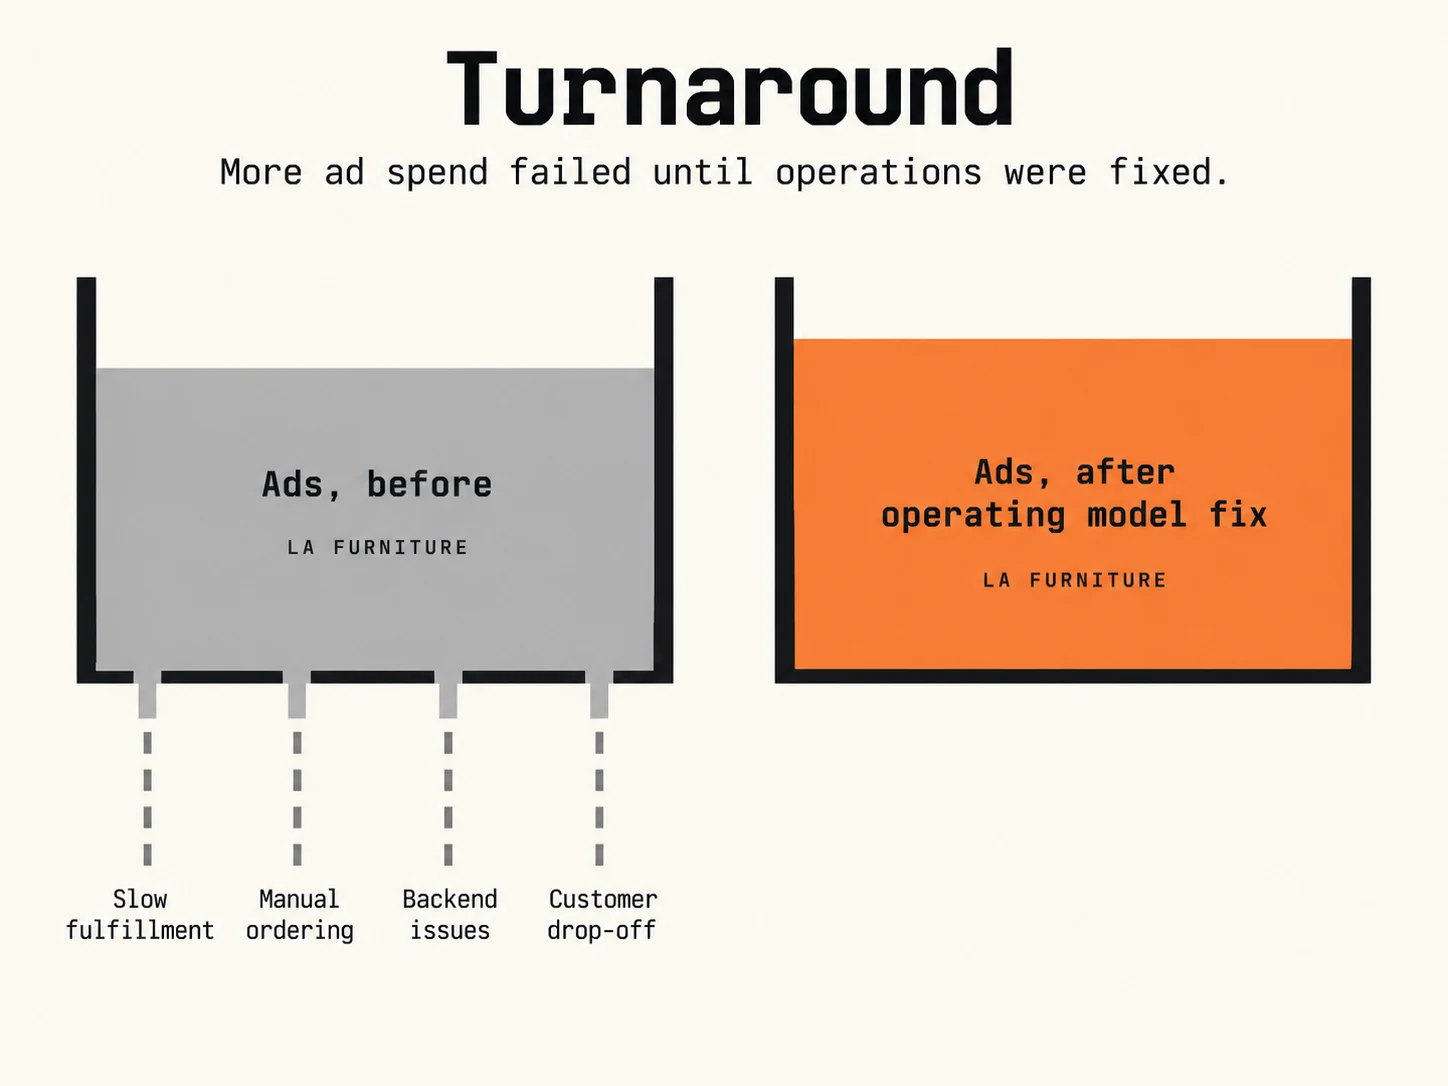
Before / after
- 01 / Before
926,812 visitors, 809 orders across sixteen months — one order per 1,146 visitors, retention at 4%, and sales, marketing, logistics and IT each reporting a different number for how the business was doing.
- 02 / March–May 2023
Operating model and cross-channel campaign rebuild live. Seven-day active users rose 61.76% while one-day actives fell 27% — visitors starting to come back, not just clicking once.
- 03 / After
Average order value $240 → $760. Retention 4% → 18%, an estimated 3,800 additional customers a year.
- Rebuilt the operating model first and the campaign mix second, on clean data
- Replaced four separate departmental processes with one framework
- Rebuilt the workflows around named ownership of each decision
- Rebuilt Facebook, Google, SEO, and email together rather than channel by channel, mapping which proposition ran down which channel rather than tuning each one separately
- Planned promotion against a calendar of retail events, with the same set of questions asked of each one, instead of running always-on
The operating model got rebuilt first — one framework replacing the four separate departmental processes, a named owner for every decision. The campaign rebuild came second, once ownership and reporting were defined clearly enough that the numbers coming out of them could actually be acted on. Facebook, Google, SEO, and email were rebuilt together instead of channel by channel, each message connected to the specific channel it was meant to run on. Promotion moved onto a calendar tied to real retail events, replacing an always-on spend pattern that had been running regardless.
Average order value rose from roughly $240 to roughly $760. Retention moved from 4% to 18%, representing an estimated 3,800 additional customers a year. Inside the ad account, prospecting bought cheap reach — $0.75 a landing page view, $0.004 an engagement — and recorded no purchases on its own. One retargeting ad set converted that same audience, returning $2,371.21 on $149.44 of spend. Google Ads returned 314% across the rebuild. Between March and May 2023, seven-day active users on the site rose 61.76% while one-day active users fell 27% — the gain was in people coming back, not in first clicks.
Before your next marketing conversation, pull your own traffic-to-order ratio and sit it next to your engagement numbers. If people are staying, scrolling, and coming back — and still not buying — the fix probably isn't in the ad account. Look at whatever happens between the click and the sale that nobody in the room has actually mapped yet. A named owner for every decision is also what a buyer looks for when the business is sold; see how to take yourself out of the business before you sell it.
- $240 → $760
- average order value
- 4% → 18%
- customer retention
- 0.087%
- site conversion at audit926,812 users, 809 orders over 16 months
The full engagement record
LA Furniture / VIG Furniture — case study