
Operations · Government, policy and non-profit
The National Bank of Ukraine needed to know where wartime support should go first. One source's "still operating" wasn't another source's "still operating."
Ukraine’s small and medium businesses were losing people, capacity, and suppliers. The National Bank needed analysis it could act on, built from sources that were late, incomplete, and politically loaded.
Ukraine's small and medium businesses were losing workers, capacity, and suppliers in 2022, and the National Bank needed analysis solid enough to guide credit and recovery decisions. Laying the available sources next to each other — government reports, business associations, international donors — the same region could look stable in one and collapsing in another, because each source was counting something different under the same label: a business association counting members who hadn't formally closed, a donor counting deliveries it had actually managed to complete, a government count running on its own reporting lag. Three real numbers, answering three different questions, none of them the same question the National Bank actually needed answered.
Waiting for those sources to reconcile wasn't available as an option. Every week of delay meant credit and recovery decisions getting made without any shared picture of what was actually happening, in a situation where a closed business doesn't reopen just because better data eventually arrives.
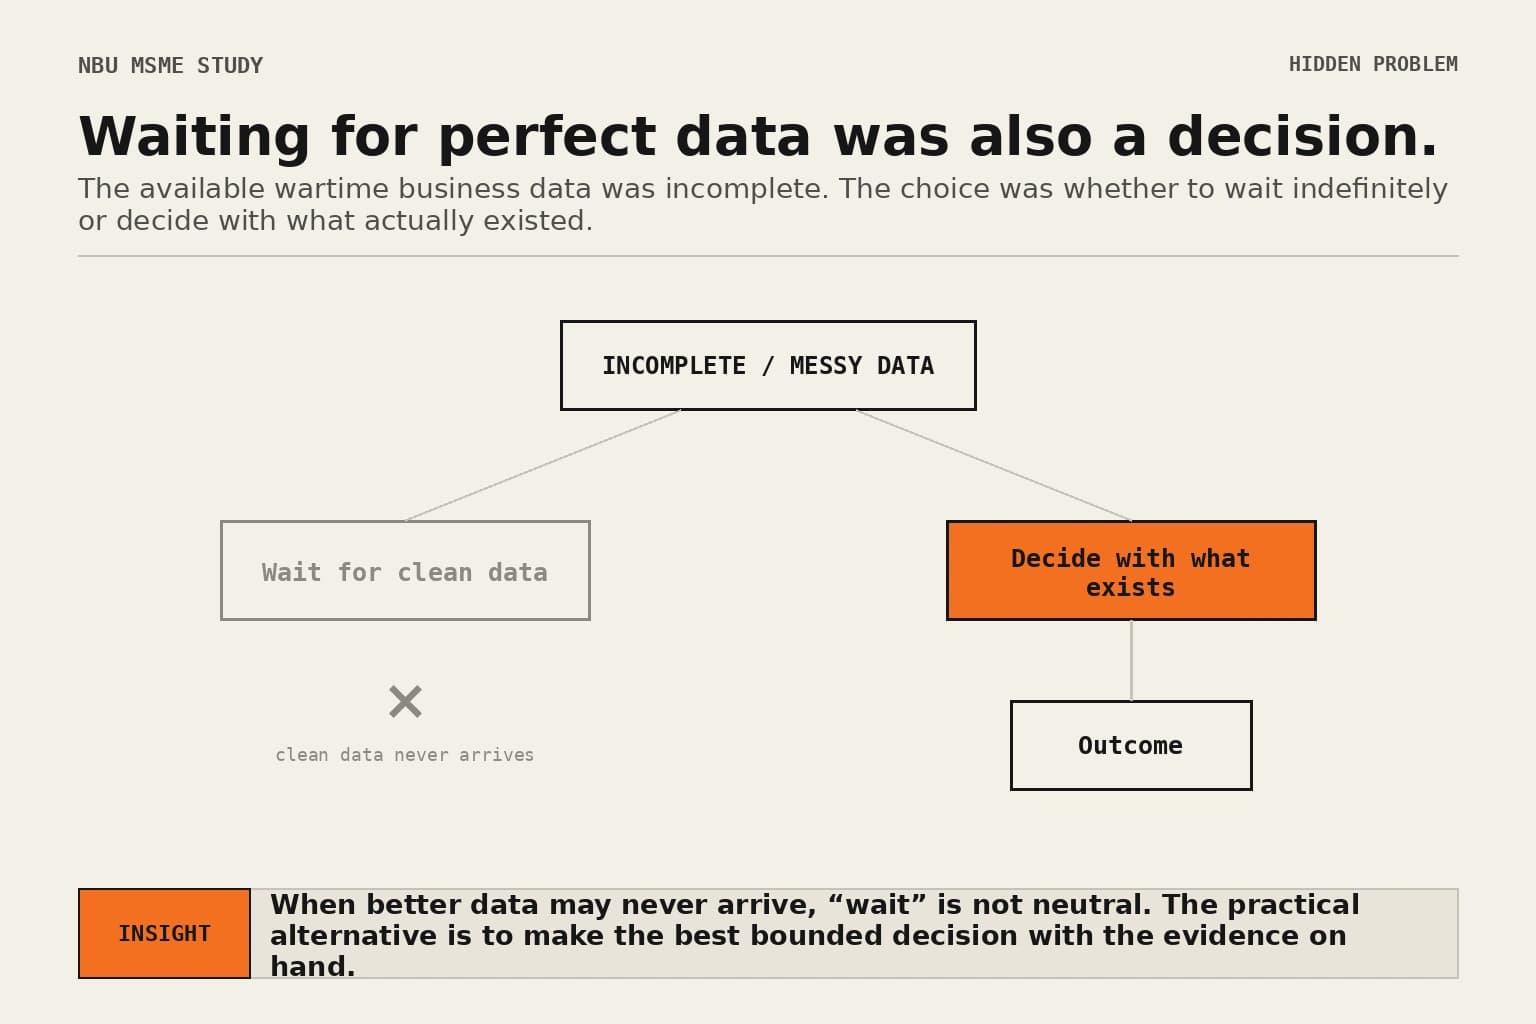
The output had to answer operational questions — what still worked, what had broken, where limited money should go first — not produce a cleaner description of the uncertainty.
Pulling the sources together anyway, rather than waiting for them to agree, showed workforce down by roughly a third and capacity down by roughly half across the sector — spread very unevenly by region and industry. That unevenness was the actually useful part of the finding. Agriculture, IT, and construction showed the strongest recovery potential, which made them the sensible place to concentrate resources that couldn't be spread evenly across every affected business.
The limitations of each source stayed attached to the conclusions instead of disappearing once the numbers were combined — not a formal methodology so much as a refusal to round the uncertainty away for the sake of a cleaner-looking number.
The study fed into national recovery planning and helped set priorities on credit access and business continuity, coordinating people who had been working from different numbers until then.
If you're making a resource-allocation decision right now with data you know doesn't agree with itself, and waiting for it to agree isn't actually available to you, check first whether your sources are measuring the same thing under the same label. Often they aren't — and once you know which definition each number is actually using, combining them tells you more than either one alone, even without either one becoming more accurate. The full method is in decision making with incomplete data.
- −33%
- MSME workforce declineSynthesised from source data
- −50%
- capacity reductionSynthesised from source data
The full engagement record
National Bank of Ukraine — case study